National crop monitoring platform: 25,000+ plots tracked daily
How a national agriculture engine combines satellite imagery and field surveys to monitor crops at scale across Africa and North America.
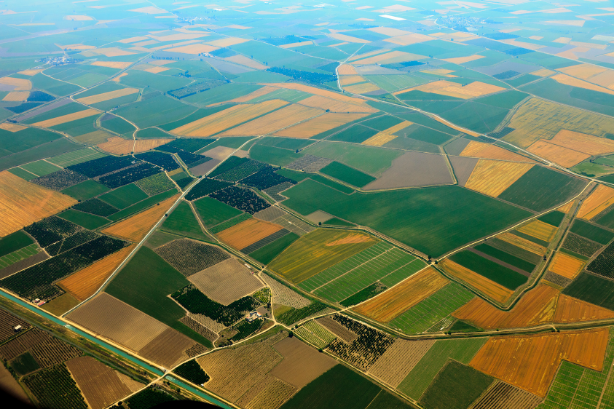
A national crop monitoring platform unifies satellite imagery, field surveys and hydrological layers so ministries can track more than 25,000 agricultural plots per day with a single operational view.
Why do national crop programs still rely on fragmented data?
Most ministries aggregate crop statistics through paper surveys and delayed satellite reports. According to the FAO, timely agricultural data remains a bottleneck for food security planning in developing regions. Teams spend months reconciling incompatible formats before any policy decision can be made.
How AgroPure deploys a unified national engine
AgroPure Analytics connects parcel boundaries, NDVI time series and mobile survey workflows into one dashboard. Field agents capture plot-level observations on smartphones while satellite pipelines refresh vegetation indices daily. Policy teams filter by region, crop type and season without exporting spreadsheets.
Measurable outcomes after 12 months
- 25,000+ plots monitored daily with automated quality checks
- 68% reduction in time to publish national crop status reports
- Single source of truth shared across three regional directorates
- Hydrological stress layers integrated for irrigation planning
We moved from quarterly PDF summaries to a live national view. Our regional teams finally work from the same parcel-level dataset.
Director of Agricultural Information, West African ministry program
Operational lessons for government teams
- Start with parcel registration before adding advanced analytics
- Train field agents on photo-based validation to reduce survey errors
- Publish a public crop dashboard to build trust with cooperatives
- Review satellite confidence scores before triggering policy alerts
FAQ
What data sources feed a national crop monitoring platform?
Typical inputs include Sentinel or Landsat imagery, GPS-tagged field surveys, weather stations and hydrological models. AgroPure normalizes these layers into comparable plot-level indicators.
How long does national deployment take?
A pilot covering one region usually runs 8–12 weeks. Full national rollout depends on parcel coverage targets and integration with existing statistical systems.
Can the platform work in low-connectivity areas?
Yes. Mobile survey modules support offline capture with automatic sync when connectivity returns.
Sources and references
For government teams
See how AgroPure Analytics can accelerate your national crop intelligence program with a tailored demo Request a demo.